House prices • HOUSING SPECIAL
10 November 2023
This article is the first in a series of 7 HOUSING SPECIAL articles that will be published every week until Christmas.
This is likely the most comprehensive report ever published on the evolution of house prices in Portugal. It will allow you to observe the evolution of the value/sqm you have been paying for a house in Lisbon, Porto, their respective metropolitan areas, and the rest of the country over the last 5 years.
The tables presented allow you to confirm the figures for yourself (and the final methodological note explains why these are the most exhaustive and reliable available on housing prices in Portugal) and understand where prices have risen the most and where and when they have fallen.
In this analysis, I will talk, with concrete examples, about the impact that accessibility, infrastructure, a pandemic, foreign demand, or political choices have on the valuation of the housing stock.
MUNICIPALITIES IN THE LISBON METROPOLITAN AREA

Panoramic view of the seafront from the historic center of Paço de Arcos.
By moedas1.
Q1 2018 – Q1 2020

Table 1.1 – Evolution of median value per sq. m. of residential property transactions by municipality in the Lisbon Metropolitan Area, between Q1 2018 and Q1 2020 (values in red represent price drops compared to the previous quarter, and the ones in bold register peaks in that municipality during the entire period under analysis).
Source: Statistics Portugal.
Q1 2020 – Q1 2022

Table 1.2 – Evolution of median value per sq. m. of residential property transactions by municipality in the Lisbon Metropolitan Area, between Q1 2020 and Q1 2022 (values in red represent price drops compared to the previous quarter, and the ones in bold register peaks in that municipality during the entire period under analysis).
Source: Statistics Portugal.
Q1 2022 – Q2 2023

Table 1.3 – Evolution of median value per sq. m. of residential property transactions by municipality in the Lisbon Metropolitan Area, between Q1 2022 and Q2 2023 (values in red represent price drops compared to the previous quarter, and the ones in bold register peaks in that municipality during the entire period under analysis).
Source: Statistics Portugal.
Tables 1.1, 1.2, and 1.3 show the evolution of housing sales' median value/sqm in the 18 Lisbon Metropolitan Area (AML) municipalities.
Lisbon, Cascais, and Oeiras are the three municipalities in the country where house prices are highest.
The most apparent conclusions are:
1) there is a consistent appreciation of housing in this region;
2) in the last year, except for Alcochete and Mafra, the prices registered have set successive records, i.e., a new high has been reached every quarter.
THE VALORIZATION OF THE CITY'S PERIMETER
In the pre-pandemic period (Q1 2018 - Q1 2020), Lisbon still recorded a very significant increase in value: 29.1%. However, the municipality of Amadora broke all appreciation records, registering growth of 47.0%.
Its proximity to Lisbon and, most likely, the extension of the Metro's blue line (the Reboleira subway station in Amadora was first opened in 2016) made this municipality a functional alternative for those who could no longer afford Lisbon's prices but didn't want to give up quick access to the center of the capital. According to Google Maps, you can get from Reboleira to Marquês de Pombal (usually considered the most central point of Lisbon) in just 19 minutes.
Between 1Q 2020 and 1Q2022, which can and should be associated with the restrictions and constraints registered through Covid-19, the appreciation of houses in Lisbon contracted to 9.3%, with quarterly decreases.
In the same period, the appreciation in Amadora fell to 20.5%, and the slowdown in the appreciation rate was felt in 13 of the 18 municipalities.
WHERE DID PRICES RISE DURING THE PANDEMIC?
When we analyze the data from the Pordata portal, we realize that the 5 municipalities where the appreciation between Q1 2020 and Q1 2022 was higher than the price growth in the two immediately preceding years are also those with the lowest population density.
Alcochete and Palmela have 150 inhabitants per square kilometer. In Mafra, Sesimbra, and Vila Franca de Xira, the same ratio varies between 250 and 450 inhabitants per square kilometer.
Do you have an idea of the population density in the municipalities of Lisbon, Amadora, or Odivelas? It's between 5,000 and 7,500 inhabitants per square kilometer.
During this period, prices tended to rise more in less dense areas of the AML. This aligns with the idea that common sense produced so much during the pandemic: more than ever, people have shown a willingness to trade centrality for space.
5 YEARS LATER, TWICE THE PRICE
Over the last year, house price appreciation has remained consistent. However, there is an inverse proportionality relationship between the value of houses in a given municipality and their appreciation rate.
In other words, the lower the house price in a given location, the greater the scope for it to rise. This is consistent with the idea that the crest of house price increases in Portugal began in the center of Lisbon (and then in Porto) and spread to its outskirts.
Finally, looking at the evolution of prices over the entire period under analysis (between Q1 2018 and Q2 2023), it should be noted that in the municipalities of Sintra, Seixal, Setúbal, Barreiro and Palmela, house prices have risen by more than 100%.
In other words, they more than doubled.
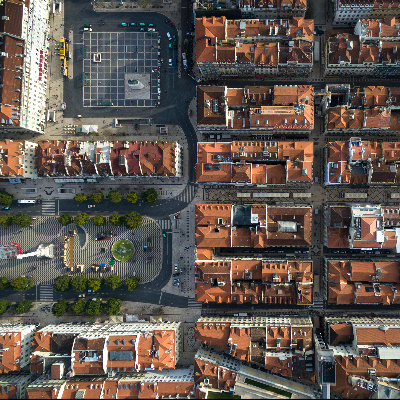
LISBON CITY PARISHES

Aerial image of Marquês de Pombal Square, the most central point of the city of Lisbon.
By Sebastio.
Q1 2018 – Q1 2020

Table 2.1 – Evolution of median value per sq. m. of residential property transactions by parish in Lisbon city center, between Q1 2018 and Q1 2020 (values in red represent price drops compared to the previous quarter, and the ones in bold register peaks in that parish during the entire period under analysis).
Source: Statistics Portugal.
Q1 2020 – Q1 2022

Table 2.2 – Evolution of median value per sq. m. of residential property transactions by parish in Lisbon city center, between Q1 2020 and Q1 2022 (values in red represent price drops compared to the previous quarter, and the ones in bold register peaks in that parish during the entire period under analysis).
Source: Statistics Portugal.
Q1 2022 – Q2 2023

Table 2.3 – Evolution of median value per sq. m. of residential property transactions by parish in Lisbon city center, between Q1 2022 and Q2 2023 (values in red represent price drops compared to the previous quarter, and the ones in bold register peaks in that parish during the entire period under analysis).
Source: Statistics Portugal.
First, what is most obvious from looking at these tables is that we should be careful when we homogeneously talk about Lisbon. Its 24 parishes and 100 square kilometers represent a heterogeneous territory with different dynamics.
THE PANDEMIC, MOBILITY, RENTING AND LOCAL ACCOMMODATION
Secondly, in general, the pandemic period has significantly penalized the evolution of prices in the capital. This is partly due to the difficulty or inability that residents in other countries sometimes face in arriving or settling in Portugal.
It's important to remember that the effect of pressure from foreign citizens on house prices is not strictly through the purchase of a property. Suppose this demand affects rents in the city. In that case, it will also impact the market value of a house, which is ultimately expressed as a multiple of the rents that the property can generate.
On the other hand, you may not remember, but during the state of emergency, the government made it impossible to cancel rental contracts for non-payment of rent. In other words, regardless of whether we agree or disagree with the measure (and we should remember that the context was probably the most atypical of our lives), the truth is that political action left landlords at the mercy of tenants.
What is the point of consulting the official data on new rents at the time (and in Q1 2021, Lisbon and Porto registered year-on-year drops in rents) when we know that in that period, there were landlords who agreed to lower rents and others who stopped receiving them? We must remember the contribution of this context when we look at Table 2.2 and see the values in red, indicating price drops compared to previous quarters
Another piece of evidence: prices in the parishes of Misericórdia and Santa Maria Maior and Misericórdia fell during the pandemic. There is also a double effect here. These two parishes geographically encompass some of the most touristic areas of the cities. So it's normal that the short and medium-term rentals that proliferate there have fallen in number and value, penalizing the expected income those properties could generate.
At that time, there was no shortage of apartments on Idealista in central areas of the city, advertised at attractive prices for periods of less than a year in the hope that the following summer, the evolution of the pandemic would once again allow for high yields in short-term formats.
On top of this are two parishes that comprise neighborhoods where restrictions on short-term rental/Alojamento Local (AL) were imposed from the outset: the so-called "containment zones".
What happened in these areas?
- New license applications for AL units are no longer accepted;
- The sale of a property with a valid license implies its expiry, making it impossible to replicate the previous activity and its profitability, penalizing the commercial value of the property.
The first two containment zones were implemented in November 2018 and affected both parishes. But, a year later these restrictions were extended and left practically the entire parish of Santa Maria Maior excluded from new AL licenses. That said, according to the Lisbon City Council (CML) and the latest 2021 Census, in Santa Maria Maior and Misericórdia the ratio of properties dedicated to LA to "Classic Family Housing" was 71.3% and 47.4%.
In other words, in each of these parishes, for every 10 dwellings where someone is expected to live permanently, there are another 7 and 5 dwellings, respectively, dedicated to AL. These are very significant figures which seem to justify the need for CML to apply geographical restrictions to new AL licenses.
But this also means that a very significant proportion of the apartments in those two parishes will lose their ability to generate income the moment they are sold (due to the extinction of the AL license and the impossibility of replicating the current business model). This also means that the price at which it will be sold will necessarily be lower than the price someone would be willing to pay for those properties if there were no restrictions on their operation.
AND NOW?
Looking at the last few quarters of the period under review, you can see that house prices in Lisbon are recovering pace. The figures recorded between Q1 2022 and Q2 2023 do not point to the stabilization of housing values that so many potential buyers are looking forward to.
The column in Table 2.3, which takes us back to the evolution of prices between 1Q 2022 and 2Q 2023, also takes us back to the start of the Ukrainian War, the escalation of prices and interest rates. In other words, during a period in which there was so much talk of a fall in purchasing power and difficulties in accessing credit, we see 16 of Lisbon's 24 boroughs/parishes appreciating by between 10% and 20% in just over a year.
That's not just higher than the national average. It's much higher than inflation. In other words, even in the center of Lisbon (a kind of zero point for the most substantial appreciation of housing in Portugal, and for this reason, also the most consensual and reasonable choice for those who risk talking about the end of the cycle), residential properties continue to appreciate substantially. Benfica and Olivais are also worth noting, with increases of 21.4% and 24.1% respectively.
Finally, and because even the most absent-minded reader would not forgive me for omitting to mention the fact that in less than four years Marvila has gone from being the cheapest parish in Lisbon to the second most expensive, I refer you to this article from last summer, which explains what "Marvila has that no other place in Lisbon can offer".
MUNICIPALITIES IN THE PORTO METROPOLITAN AREA

Arial view of Anémona, an installation near Matosinhos Beach.
By Pedro Menezes.
Q1 2018 – Q1 2020

Table 3.1 – Evolution of median value per sq. m. of residential property transactions by municipality in the Porto Metropolitan Area, between Q1 2018 and Q1 2020 (values in red represent price drops compared to the previous quarter, and the ones in bold register peaks in that municipality during the entire period under analysis).
Source: Statistics Portugal.
Q1 2020 – Q1 2022

Table 3.2 – Evolution of median value per sq. m. of residential property transactions by municipality in the Porto Metropolitan Area, between Q1 2020 and Q1 2022 (values in red represent price drops compared to the previous quarter, and the ones in bold register peaks in that municipality during the entire period under analysis).
Source: Statistics Portugal.
Q1 2022 – Q2 2023

Table 3.3 – Evolution of median value per sq. m. of residential property transactions by municipality in the Porto Metropolitan Area, between Q1 2022 and Q2 2023 (values in red represent price drops compared to the previous quarter, and the ones in bold register peaks in that municipality during the entire period under analysis).
Source: Statistics Portugal.
CONCENTRATION OF THE HIGHEST VALUATIONS AROUND THE CITY OF PORTO
Let's look at Table 3.3, where we can see the appreciation of the median value/sqm of the prices at which houses were sold over the entire period under analysis. We realize that contrary to what happened in the Lisbon region (where prices essentially doubled in the more peripheral municipalities of that metropolitan area), the most significant increases in value occurred precisely in 3 of the 4 municipalities that share geographical boundaries with Porto: Matosinhos, Vila Nova de Gaia and Gondomar.
It should be added that in the four municipalities where prices are lowest, appreciation has been least consistent in recent quarters. Even Arouca is showing a marginally negative trend (if you go there - and I suggest you do, the Paiva Walkways are incredible - you'll feel like you're in a rural area, not a metropolitan one).
This shows that, as residential property values and real estate investment have expanded from the center of Portugal's two largest cities to their outskirts, it should be noted that in the North, the strength of this cascade effect is more limited.
An interesting note: (according to Confidencial Imobiliário, a database specializing in the residential segment) Vila Nova de Gaia could be the municipality with the highest number of properties in the pipeline in the country. This is because, in 2022, 19,500 new residential projects were submitted for municipal licensing in mainland Portugal, amounting to 43,800 units across 278 municipalities. Gaia is responsible for the largest number of these dwellings (2,800). Porto with 1,650 and Matosinhos with less than 1,500 dwellings (Lisbon with 2,120 dwellings, Braga, Oeiras and Guimarães are the other municipalities with more than a thousand units in production).
PORTO CITY PARISHES

Largo dos Lóios, Porto's historical city center.
By Rh2010.
Q1 2018 – Q2 2020

Table 4.1 – Evolution of median value per sq. m. of residential property transactions by parish in Porto city center, between Q1 2018 and Q1 2020 (values in red represent price drops compared to the previous quarter, and the ones in bold register peaks in that municipality during the entire period under analysis).
Source: Statistics Portugal.
Q1 2020 – Q1 2022

Table 4.2 – Evolution of median value per sq. m. of residential property transactions by parish in Porto city center, between Q1 2020 and Q1 2022 (values in red represent price drops compared to the previous quarter, and the ones in bold register peaks in that municipality during the entire period under analysis).
Source: Statistics Portugal.
Q1 2022 – Q2 2023

Table 4.3 – Evolution of median value per sq. m. of residential property transactions by parish in Porto city center, between Q1 2022 and Q2 2023 (values in red represent price drops compared to the previous quarter, and the ones in bold register peaks in that municipality during the entire period under analysis).
Price trends in Porto remain consistent. However, if you look strictly at the last few quarters, it no longer offers a more significant margin for appreciation than Lisbon. But I believe what is about to happen in Campanhã could make the east of the city even more dynamic.
URBAN REGENERATION AND ITS LEGACY
In the União de Freguesias (UF) of Aldoar Foz do Douro e Nevogilde (which, as the name suggests, includes the famous Foz area), in the historic center of Porto (UF of Cedofeita, Santo Ildefonso, Sé, Miragaia, São Nicolau and Vitória), and in the UF of Lordelo and Massarelos (which includes Bairro Gomes da Costa, Serralves, Campo Alegre, Bom Sucesso, Galiza, and a large part of the riverside strip between Foz and Miragaia) there are still consistent increases in value. But the bulk of urban regeneration, after the boom in the historic center, seems to be taking place in Bonfim and Campanhã.
It is precisely in these two parishes that values have soared in the last five years.
This has happened because as prices in the historic area have risen, interest in the neighborhoods to the East (in the opposite direction to the mouth of the River Douro) has increased. After all... how many corners around Passeio de São Lázaro or Campo 24 de Agosto, consensually described as decadent less than 10 years ago, haven't become a regular feature in Time Out magazine?
Finally, a word for the Metrobus, a new means of transport which, according to Metro do Porto, "combines the efficiency, punctuality and reliability already known from the Metro with the flexibility and comfort of the latest generation of the ecological, hydrogen-powered bus", and has "priority over all other modes of transport (through an intelligent traffic light system"). Its first section should be available in the summer of 2024, and will provide transportation between Casa da Música, Serralves and Praça do Império.
MUNICIPALITIES OF THE DISTRICTS' AND REGIONAL GOVERNMENTS' CAPITALS

View over Coimbra city center.
By mlehmann78.
Q1 2018 – Q1 2020

Table 5.1 – Evolution of median value per sq. m. of residential property transactions in the municipalities of the districts and the regional governments capitals, between Q1 2018 and Q1 2020 (values in red represent price drops compared to the previous quarter, and the ones in bold register peaks in that municipality during the entire period under analysis).
Q1 2020 – Q1 2022

Table 5.2 – Evolution of median value per sq. m. of residential property transactions in the municipalities of the districts and the regional governments capitals, between Q1 2020 and Q1 2022 (values in red represent price drops compared to the previous quarter, and the ones in bold register peaks in that municipality during the entire period under analysis).
Q1 2022 – Q2 2023

Table 5.3 – Evolution of median value per sq. m. of residential property transactions in the municipalities of the districts and the regional governments capitals, between Q1 2022 and Q2 2023 (values in red represent price drops compared to the previous quarter, and the ones in bold register peaks in that municipality during the entire period under analysis).
The analysis of the evolution of housing prices in Portugal has essentially been based on the two metropolitan areas, which together account for 45% of the national population.
But it was essential to talk about what's happening in the rest of the country, not least because Lisbon and Porto have long since ceased to be the only places attracting new inhabitants, whether national or foreign.
THE NATIONAL TOP 10
Do you know how many municipalities the median value/sqm for which houses are sold exceeds €2,500? 10.
Want to know which ones? In descending order: Lisbon, Cascais, Oeiras, Loulé, Lagos, Vila do Bispo, Aljezur, Porto, Albufeira, Tavira.
Is the value/sqm higher in Sagres than on Avenida da Boavista in Porto? Surprising as it may seem, we discovered this is possible in the light of these figures (the most reliable possible in Portugal; see final methodological note).
The truth is that 6 of the 10 most expensive municipalities to buy a house in Portugal are in the Algarve.
A SMALL VILLAGE BY THE SEA
Even without ignoring the impact of tourism, its giant waves, and those who dare to surf them, Nazaré is the big surprise in this national analysis of house price trends. Out of 308 municipalities across the country, this town is Portugal's 23rd most expensive municipality, at €2,065/sqm (55% more than Leiria, its district capital).
I decided to investigate further: the median house price/sqm in that municipality has risen by 24.8% in the last year (similar to the price evolution in Amadora in the two years preceding the pandemic).
And in the last quarter alone, housing values grew by 12.2%. To give you an idea, that's more than the average house price increase across the country in a year.

View over the giant waves of Nazaré and the lighthouse of São Miguel Arcanjo Fort.
By Hugo Amaral.
COAST VS. INLAND: THE GREATEST NATIONAL CONTRAST
Nazaré is just a picturesque caricature of a reality known for a long time. If we divide Table 5.3 in half, we realize that, among the 10 capitals with the highest land prices, there are only 3 that are not bathed by the sea or an estuary: Évora (a city with a deep tourist tradition), Coimbra (an obligatory stop for any train that runs between Lisbon and Porto, and home to the oldest university in the country), and Braga (the most significant urban center outside the metropolitan areas of Lisbon and Porto).
This is just a reminder of what most 10-year-olds will have learned at school: in Portugal, the most substantial contrasts are between the interior and the coast.
It is on the coast that the price of land is highest. This is because these geographical areas almost always tend to have a higher population pressure (demographics are often overlooked, but they are also the factor with the most significant impact on the valuation of residential buildings). And it's no coincidence that Portalegre, the district capital with the lowest value/m2 in the whole country, is also, according to the 2021 Census, the district capital with the most minor population and the one that lost the most inhabitants in the previous ten years.
UNIVERSITIES AND HOUSE PRICES
Portugal has 13 public universities. Of the 10 cities in the first half of these tables, only Setúbal is not home to a university. On the other hand, of the 10 cities in the second half of the tables, only one, Vila Real, is home to the University of Trás-os-Montes and Alto Douro. Even so, it should be noted that these cities are home to polytechnic institutes.
The presence of a university in a district capital can make a city and a region known to students from other parts of the country (and other countries). It contributes to boosting the local economy and impacts not only demand but even defining the supply of the residential sector, which will probably adapt to the fact that thousands of students will be looking for a place to sleep during the academic year.
This means that, for example, rents in the city of Aveiro would only be so high if there was a university there. And that the increase in this potential income also influences the value at which residential property can be sold.
In fact, if there are two sub-segments in which there seems to be the will and (good) reasons to want to invest, they are precisely student housing and, because demographics are once again enlightening, senior housing.
CONCLUSIONS

Aerial cityscape of Ferragudo by Arade River, in Algarve.
By malajscy.
The main aim of this text has been to share the fundamentals of price dynamics over the last five years in each of these geographies. So, with more data and information, the reader can consider new variables or pay attention to other aspects. Because the answer to the most famous question of all time - "What will happen tomorrow?" - can never (try to) be answered based on just one or two variables.
But we still remember that the main reason for the slowdown on the demand side is related to the rise in interest rates. And that this rise was nothing more than the central banks' response to inflation. Even though they are falling year-on-year in the Eurozone and Portugal, it's important to stress that only in the coming months will we be able to see how robust this trend is.
In any case, for the first time since July 2022, the European Central Bank didn't change (raise) its key rates.
Still on the subject of inflation, one of the events that contributed significantly to the rise in prices was the war in Ukraine. On the other hand, it is curious to note that, since last year, many Ukrainian and Russian families have moved to Portugal. In other words, while it's true that an armed conflict will always hurt the economy, it's also true that Portugal has become a destination of refuge. Therefore, more houses are demanded to rent (or possibly buy). Not only because of its distance from the conflict (if you were an investor, where would you feel more comfortable putting your money, in Eastern Europe or the westernmost of countries?), but also because in 2021 (before the war began) the Ukrainian community was already the 7th most significant foreign representation in Portugal.
As for supply, many are surprised that fewer sales are forced by the high-interest context in a country where most mortgages have variable rates. In this respect, it is worth noting the political efforts to ease the burden on credit installments: after the obligation for banks to come up with solutions to lower the installment came the postponement of the payment of 30% of the Euribor value.
On the other hand, these sales may be happening occasionally, but as of today, no one will have to go through the traumatic episode of "handing over" their house to the bank. For one simple reason: unlike 10 years ago, house prices are still going up, not down.
Over the next six weeks, I'm going to publish a weekly text in which I'll address each of this year's most discussed housing issues. It will be an approach detached from inclinations, biases, ideological ascendancies or urban mythology.
What I promise you is no less than this: an objective and impartial analysis of each of the hottest topics in the residential real estate market.
BRIEF METHODOLOGICAL NOTE
All data shared in this article was sourced from the House Price Statistics at the local level of Statistics Portugal (INE), which immediately presents three methodological advantages over any report on housing prices in Portugal:
1) It refers to the actual transaction values and the Gross Private Area contained in the property's Tax Authority Property Description (thus ensuring consistent information on prices per square meter), information only possible thanks to the existing protocol with the Tax and Customs Authority (AT), which provides INE with access to information of a fiscal nature;
2) It includes all property transactions in Portugal whose use is "housing", with a private gross area exceeding 20 sq. m.;
3) The results published for each quarter correspond to the information registered for the reference quarter and for the three previous quarters, which enables significant mitigation of any eventual seasonal effects on the behavior of sales (in the specific case of the pandemic context, it makes sense to consider that the discrepancies in the quarters in which restrictions occurred may have been more evident than the figures published by INE suggest).
Other related studies by INE
INE also publishes statistics on bank appraisals. But it is important to remember that:
a) A substantial part of the houses in Portugal are not purchased using financing;
b) Bank appraisals are largely obtained by analyzing the advertised values of houses that, almost always, don’t correspond to the prices practiced.
Studies produced by portals, brokers and databases
Note that when we are dealing with a report carried out by a real estate portal, the results are based on the asking price (which, in most cases, does not correspond to the real transaction value). There is also no way to ensure that the areas displayed are correct. In fact, it often happens that we find the same property advertised in the very same portal, for different prices and different private areas.
On the other hand, if the report was carried out by a real estate brokerage brand, it may present real transaction values, but only for those cases in which it had direct intervention, which significantly limits the study’s scope.
There are also databases that have access to transaction values communicated to them by affiliated brokerage companies. But, in any case, they ignore all transactions carried out by individuals or brokerage companies with which they have no relationship.
For these reasons, I understand that INE's local Housing Price Statistics are the ones that offer the most exhaustive and representative picture of the entire universe of housing prices in Portugal.